Financial Data

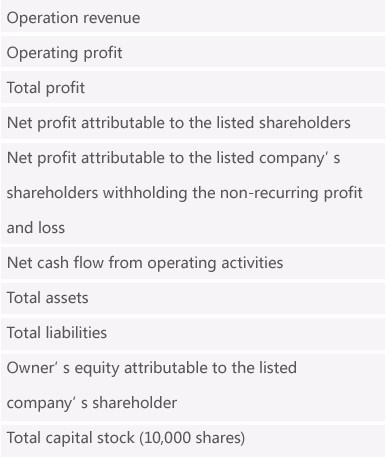
Main Accounting Data

Items
2020

Increase or decrease

compared with last year

  • 17.05 15.03%
  • 5.54 10.21%
  • 5.92 17.69%
  • 5.03 19.19%
  • 4.70 11.42%
  • 5.61 -10.51%
  • 27.01 10.01%
  • 2.53 13.90%
  • 24.48 9.63%
  • 65,801.094 100.56%
  • 60.95 15.83%
  • 17.89 484.33%
  • 17.69 516.29%
  • 15.24 528.29%
  • 11.44 365.82%
  • 15.66 1.94%
  • 96.40 15.72%
  • 26.98 12.44%
  • 69.42 17.04%
  • 158102.06 -0.09%
  • 52.62 20.94%
  • -4.65 -137.63%
  • -4.25 -142.21%
  • -3.56 -135.51%
  • -4.31 -147.11%
  • 15.37 13.90%
  • 83.31 -14.91%
  • 23.99 -17.34%
  • 59.31 7.16%
  • 158,249.255 7.74%
  • 43.51 39.86%
  • 11.03 25.53%
  • 11.29 27.57%
  • 10.02 30.79%
  • 9.14 41.89%
  • 13.49 41.36%
  • 97.90 60.14%
  • 29.02 195.68%
  • 55.92 9.63%
  • 146,881.788 -0.09%
  • 31.11 34.72%
  • 8.78 38.14%
  • 8.85 35.38%
  • 7.66 43.17%
  • 6.44 35.35%
  • 9.54 39.39%
  • 61.14 14.74%
  • 9.82 57.15%
  • 51.01 8.99%
  • 147,012.188 -0.01%
  • 23.09 1.90%
  • 6.36 -11.79%
  • 6.54 -11.66%
  • 5.35 -15.78%
  • 4.76 -21.89%
  • 6.85 7.84%
  • 53.28 8.62%
  • 6.25 77.69%
  • 47.04 3.29%
  • 147,032.188 101.96%
  • 22.66 32.91%
  • 7.21 30.09%
  • 7.40 24.94%
  • 6.35 26.44%
  • 6.09 29.54%
  • 6.35 13.24%
  • 49.05 81.60%
  • 3.52 38.69%
  • 45.62 86.38%
  • 72,801.090 10.64%
  • 17.05 15.03%
  • 5.54 10.21%
  • 5.92 17.69%
  • 5.03 19.19%
  • 4.70 11.42%
  • 5.61 -10.51%
  • 27.01 10.01%
  • 2.53 13.90%
  • 24.48 9.63%
  • 65,801.094 100.56%
  • 60.95 15.83%
  • 17.89 484.33%
  • 17.69 516.29%
  • 15.24 528.29%
  • 11.44 365.82%
  • 15.66 1.94%
  • 96.40 15.72%
  • 26.98 12.44%
  • 69.42 17.04%
  • 158102.06 -0.09%

Main Financial Indexes

Main Financial Indexes
Basic EPS (RMB)
Net cash flow from operation per share (RMB)
Weighted average return on equity
Asset-liability ratio
Quick ratio
Turnover rate of accounts receivable
Inventory turnover rate
Gross profit rate
20202019

0.96

0.99

23.97%

27.99%

1.78

43.89

2.81

62.82%

-0.24

0.97

-6.50%

28.80%

1.74

31.41

2.55

65.78%

0.69

0.69

19.00%

29.65%

2.30

23.15

2.57

67.66%

0.52

0.52

15.80%

16.06%

3.98

29.79

2.69

67.08%

0.37

0.47

0.47

11.72%

4.77

43.48

2.53

64.40%

0.89

0.87

15.69%

7.17%

8.44

47.56

2.47

66.28%

0.77

0.85

22.02%

9.38%

6.92

40.87

2.51

65.98%

Dividend Policy

Dividend yearDistribution policyCash dividend amount (RMB 10,000)Ratio of the net profit attributable to the listed company’s shareholder in consolidated statement
2020RMB 7.0 distributed per 10 shares (including tax)1,106,714,38872.61%
2019RMB 3.6 distributed per 10 shares (including tax)569,697,319-160.08%
2018RMB 5.0 distributed per 10 shares (including tax)734,408,94073.28%
2017RMB 3.3 distributed per 10 shares (including tax)484,859,72063.28%
2016RMB 2.6 distributed per 10 shares (including tax)382,283,688.871.43%
2015RMB 6 distributed upon addition of 10 shares (including tax)436,806,56468.73%
2014RMB 5 distributed per 10 shares (including tax)364,005,47072.43%
2013RMB 10 distributed upon addition of 10 shares (including tax)328,080,00077.8%
2012RMB 6 distributed upon addition of 5 shares (including tax)131,232,00046.81%
2011RMB 10 distributed upon addition of 10 shares (including tax)109,360,00058.66%
2010RMB 10 distributed upon addition of 10 shares (including tax)546,800,00059.37%